Hey there! Greetings and congrats to this nice discourse forum! We again come with a question, of course
tl;dr: Does CG4 continues to cache data during a scan session and is there a function to call that manually erases cache without having to close/reopen the software?
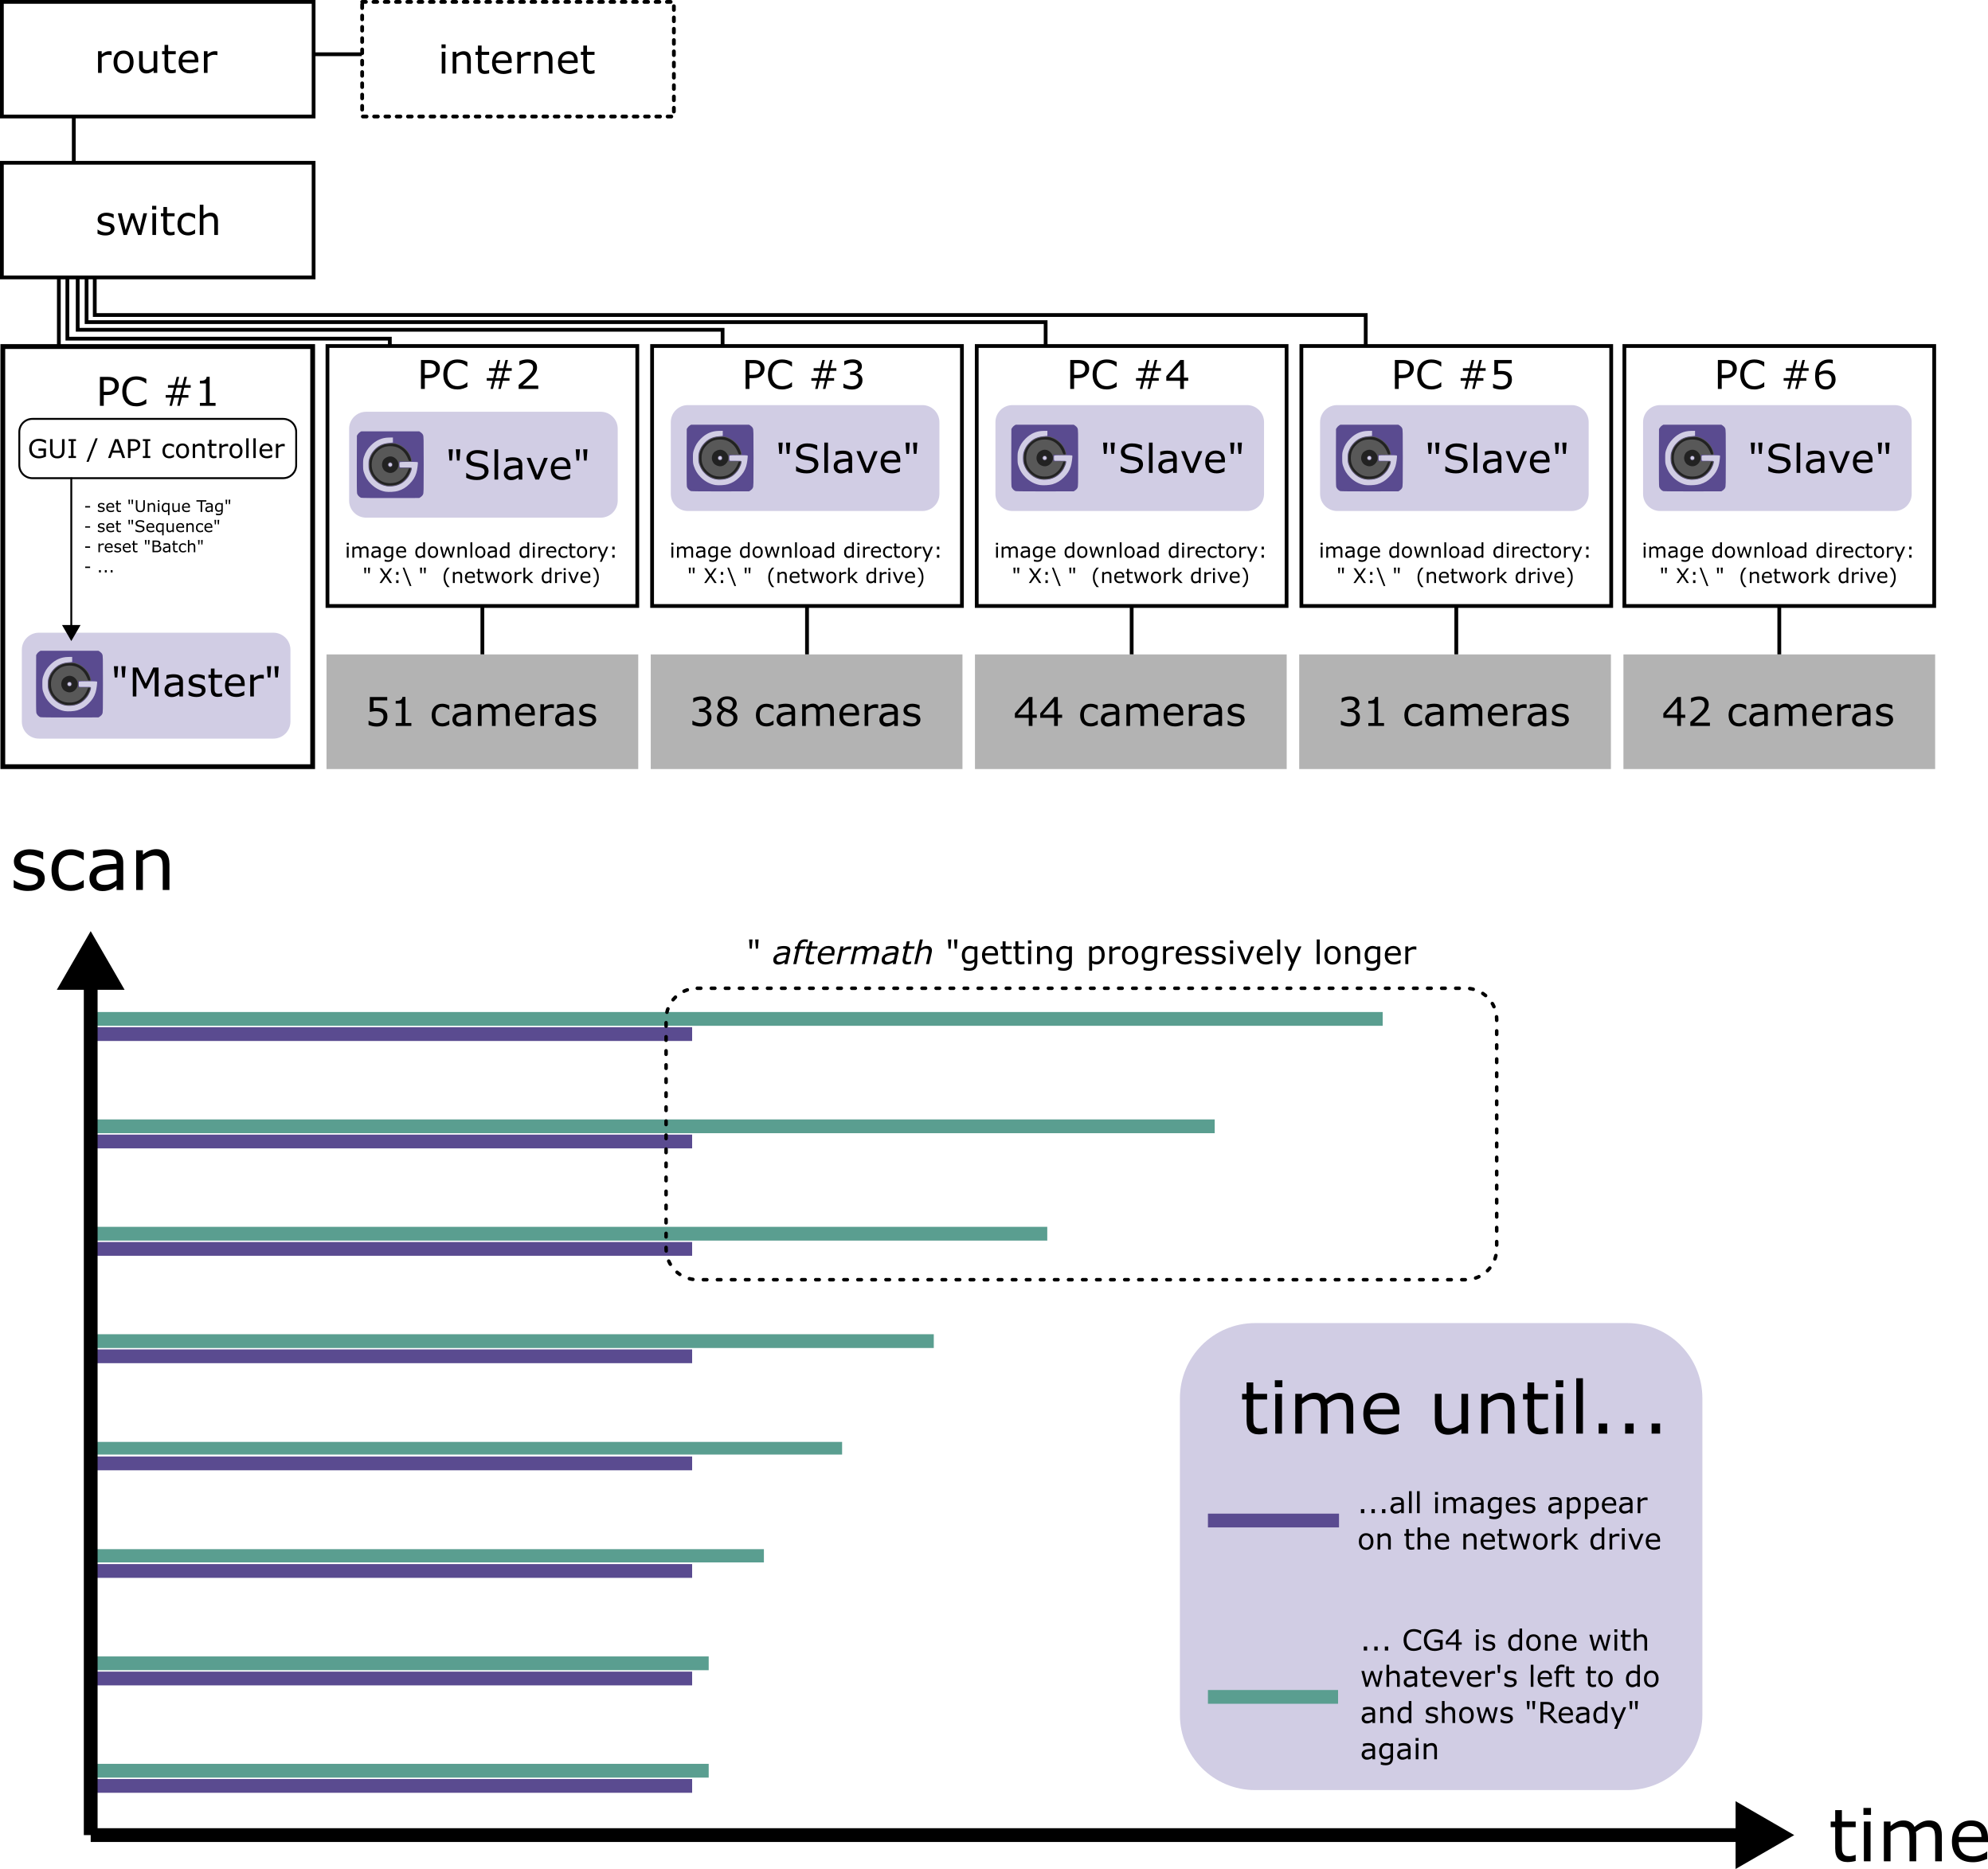
Now here the full story: 1. Background: We run DLSR racks and have lots of experience with all cameras being connected to one PC. Currently we are distributing the scanning workload over several PCs with one “Master” telling the “Slaves” their UniqueTags, BatchNumbers and so on. The “Master”-PC itself does not collect (as in: “Sync”) any images, nor do the slaves. All camera images from all PCs are being directly downloaded onto a network drive that is visible to all of them.
2. Issue: Now, each scan, 416 images are taken. Your software takes just ~30 seconds to be “Ready” again for the next shot. So far, so great! But if we continue to perform such scans, this “Scan-to-Ready”-time slowly increases each time by a few seconds. These extra seconds pile up and do not cool down even when you pause scanning for a bit. When we resume scanning after a break of a few minutes, the pile of “extra-seconds” is still present and slows down the processing tremendously, eventually resulting in other software errors (i.e. “Batch number” not getting reset correctly…). To make this clear: The images are always present on our network drive after the same small amount of time (~30 s). It is only the -let’s say- aftermath that CG4 needs to be “Ready” again that is getting longer and longer.
Only when we fully close the CG4 software on the “Master”-PC and restart it, we observe a reasonable “Scan-to-Ready”-time again. Unfortunately, closing the software from time to time is not an option for us.
3. Question: This feels like there is probably some cache building up that eventually leads to the described issue. We could not find anything so far, so we’re thankful for any advice in that or in any other direction. Ideally, there is a function we could call that works as an intermediate-cache-clear
Can you give us any hint / solution / follow-up question?
As always, we appreciate your caring and are looking forward to any kind of response. If need be, we could provide logfiles via some sort of private exchange channel (mail, …).
Thanks for reporting this, and for the very detailed description!
I’ve been trying to think of any explanation of why the performance degrades in this way, but I’ve not figured it out yet. So I need to do more investigation into this.
First I had a couple of questions;
Your software takes just ~30 seconds to be “Ready”
How are you checking that it is ready?
Are you looking at the status and icon at the top right of the main window?
Or maybe in the camera table, looking at the status of each camera?
Can you also check the slave nodes when the issue happens; do they reach the ready state before the master? Or are they also slowing down in the same way?
Its also odd that restarting the master fixes the issue temporarily. Because when the master starts up, it will synchronise with the slaves, and reach the same state as before. So right now I can’t explain why restarting only the master (and not also the slaves) alleviates the issue.
Hey Francis, thank you for your replies!
Let me try to answer your questions..
First guess is correct. We are observing the status icon at the top right corner of the main window.
As far as I am aware this is also the relevant indicator caught by our GUI-overlay to display its own “Ready-to-scan”-message again..
Yes, they display their respective “Ready” status icon as soon they they’re done downloading the images onto the network drive. We did not observe any questionable behaviour on the slaves CG instances. From what we see it appears that the accumulation of aftermath-seconds takes place on the “Master”-PC only.
Forgive us the missing completeness of the our initial post in that part of the story…
That process description is incomplete. When we would restart the “Master”-PC’s CG only, it would fail to auto-recognize the slave node connections correctly and hang up. Therefore “restarting the master” in our case includes restarting the slave node CG instances as well. Sorry for the puzzlement! Our (issue-resolving) restarting order was like
Close CaptureGrid on “Master”-PC
Close CaptureGrid on each “Slave”-PC
Re-Open CaptureGrid on “Master”-PC
Re-Open CaptureGrid on each “Slave”-PC
Guessing from your feedback so far, there seems to be no obvious “clear-cache” function that would solve all our problems, right? We will postpone our wishful thinking for now and instead look forward to your next reply.
As always, don’t hesitate to ask us to perform certain tests or deliver additional information. It may take some time on our side since we recently moved the rig, but hey, still looking for and willing to help.

 But if we continue to perform such scans, this “Scan-to-Ready”-time slowly increases each time by a few seconds. These extra seconds pile up and do not cool down even when you pause scanning for a bit. When we resume scanning after a break of a few minutes, the pile of “extra-seconds” is still present and slows down the processing tremendously, eventually resulting in other software errors (i.e. “Batch number” not getting reset correctly…). To make this clear: The images are always present on our network drive after the same small amount of time (~30 s). It is only the -let’s say- aftermath that CG4 needs to be “Ready” again that is getting longer and longer.